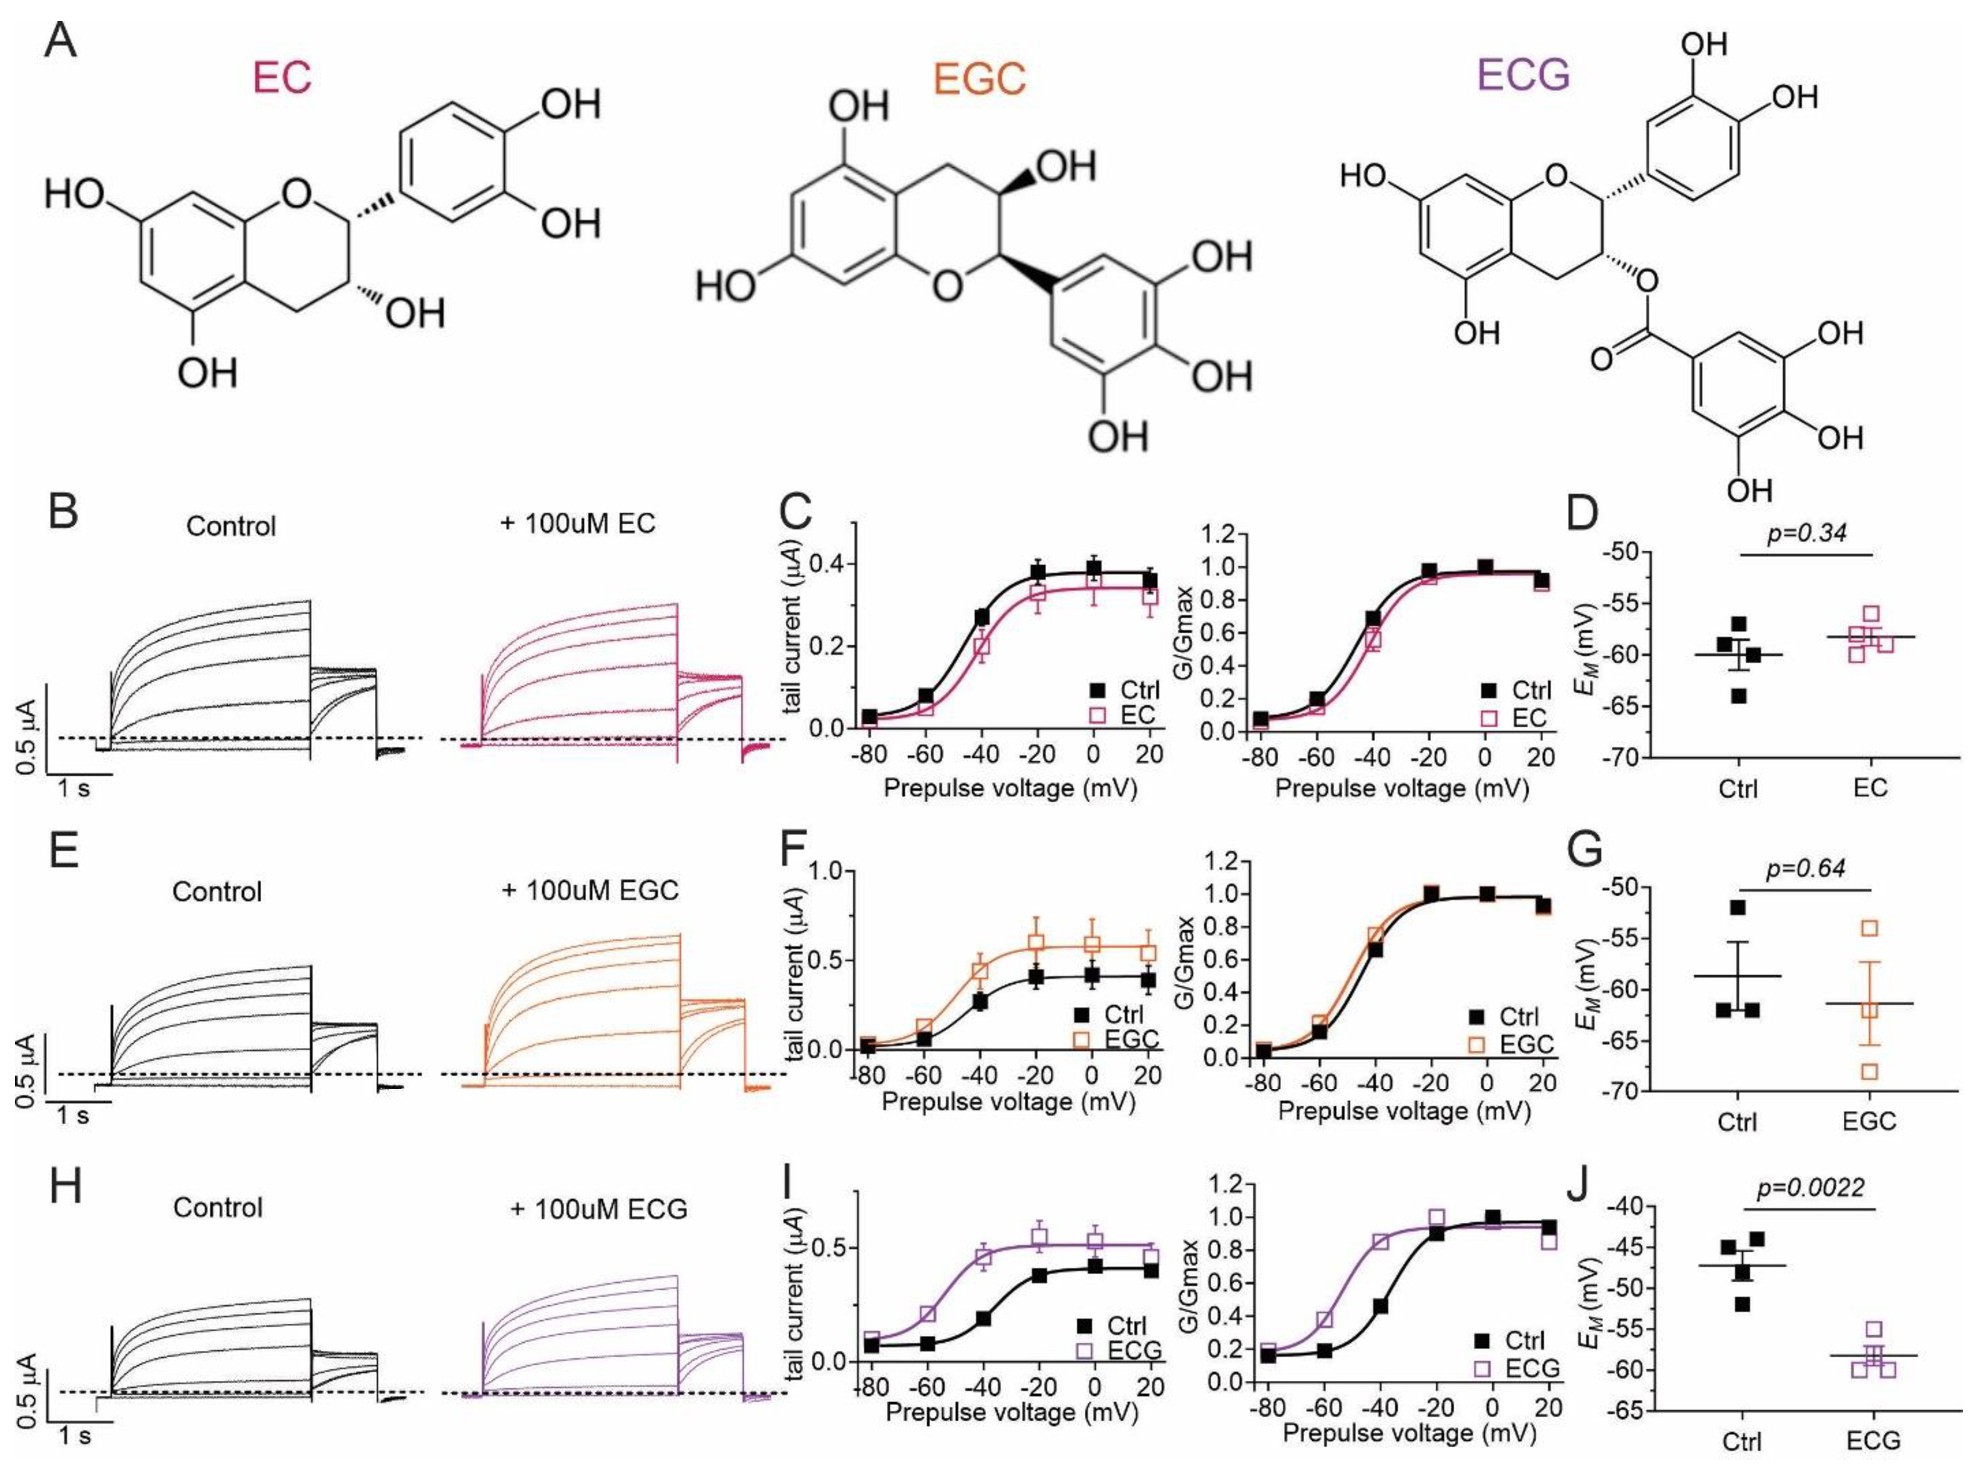
Fig. 4. Epicatechin gallate activates KCNQ5 channels. All error bars indicate SEM. A: Chemical structures of compounds used in this study, from left to right: (-)-epicatechin (EC), (-)-epigallocatechin (EGC), and (-)-epicatechin gallate (ECG). B: Mean KCNQ5 traces in the absence (Control) and presence of 100 µM EC (n = 4). C: Left, mean tail current; right, mean normalized tail current (G/Gmax) verses prepulse voltage for traces as in B (n = 4). D: Scatter plot of unclamped membrane potential (EM) for cells as in B (n = 4). Statistical analyses by two-way ANOVA. E: Mean KCNQ5 traces in the absence (Control) and presence of 100 µM EGC (n = 3). F: Left, mean tail current; right, mean normalized tail current (G/Gmax) verses prepulse voltage for traces as in E (n = 3). G: Scatter plot of unclamped membrane potential (EM) for cells as in E (n = 3). Statistical analyses by two-way ANOVA. H: Mean KCNQ5 traces in the absence (Control) and presence of 100 µM ECG (n = 4). I: Left, mean tail current; right, mean normalized tail current (G/Gmax) verses prepulse voltage for traces as in H (n = 4). J: Scatter plot of unclamped membrane potential (EM) for cells as in H (n = 4). Statistical analyses by two-way ANOVA.